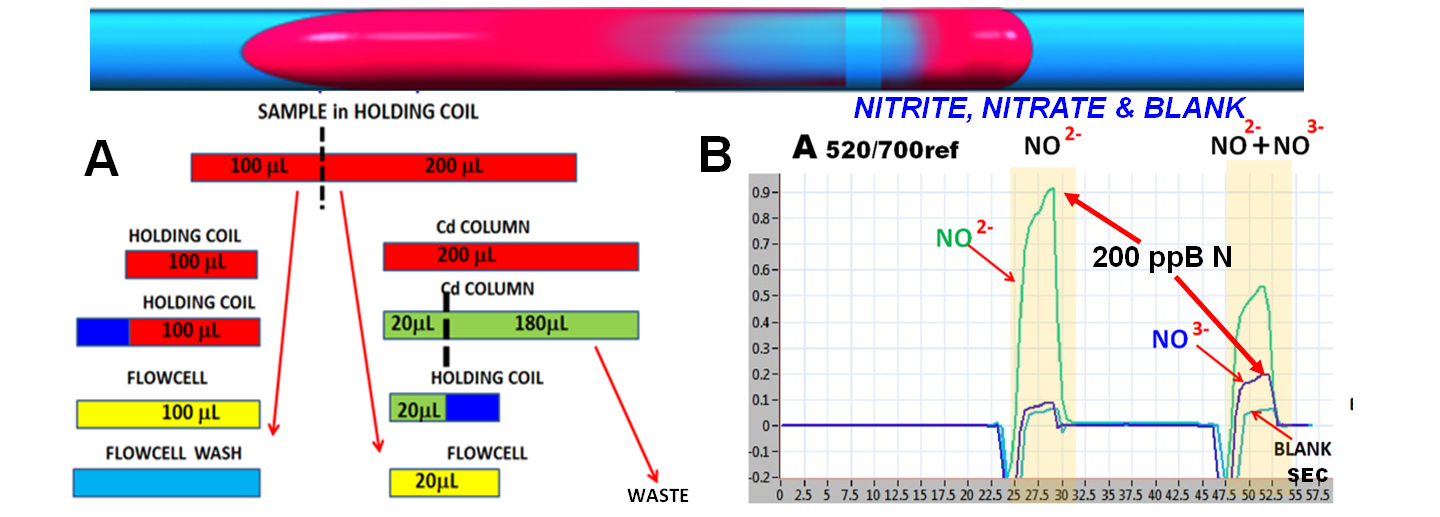
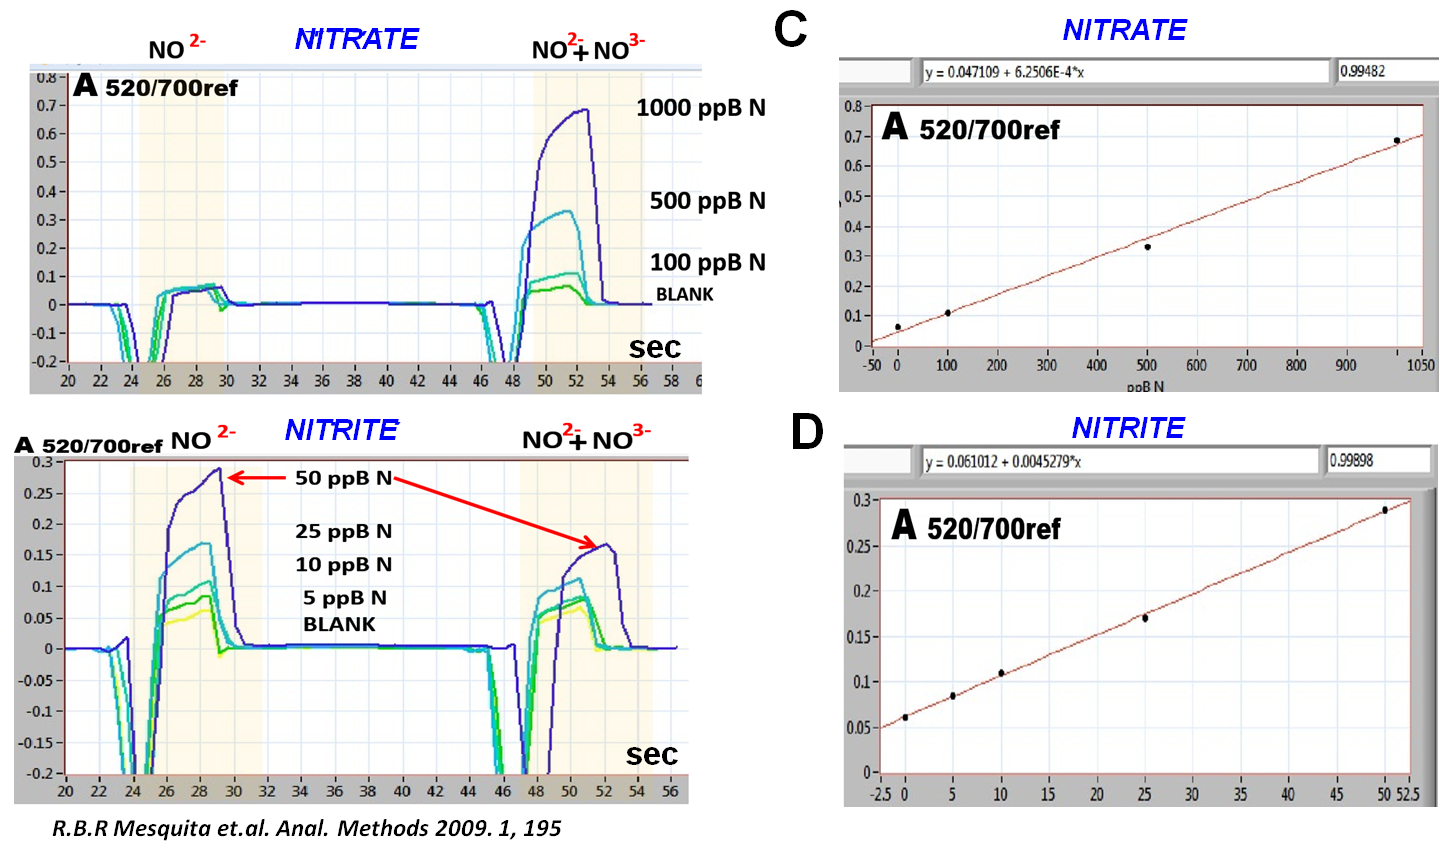
Real life samples, such as sea water, contain lower concentrations of nitrite than of nitrate (Mesquita 2009). To analyze such solutions, the sample zone can be split unevenly (A). Consequently, injections of separate nitrite, and nitrate samples (200 ppB N) yields traces, which, when overlaid (B), show nitrite peak (green) that is after correction for blank, seven times higher than nitrate peak (blue). Therefore the corresponding calibration graphs (C,D) show ratio of slopes 45/6.3. The discrepancy between dilution 5/1 and 7/1 slope is caused by channel geometry, which leaves a tail portion of a 20 mcrL nitrate sample within LOV, and therefore unreduced.


Simultaneous Nitrite & Nitrate Assay
Uneven sample split 5/1
2.2.23.